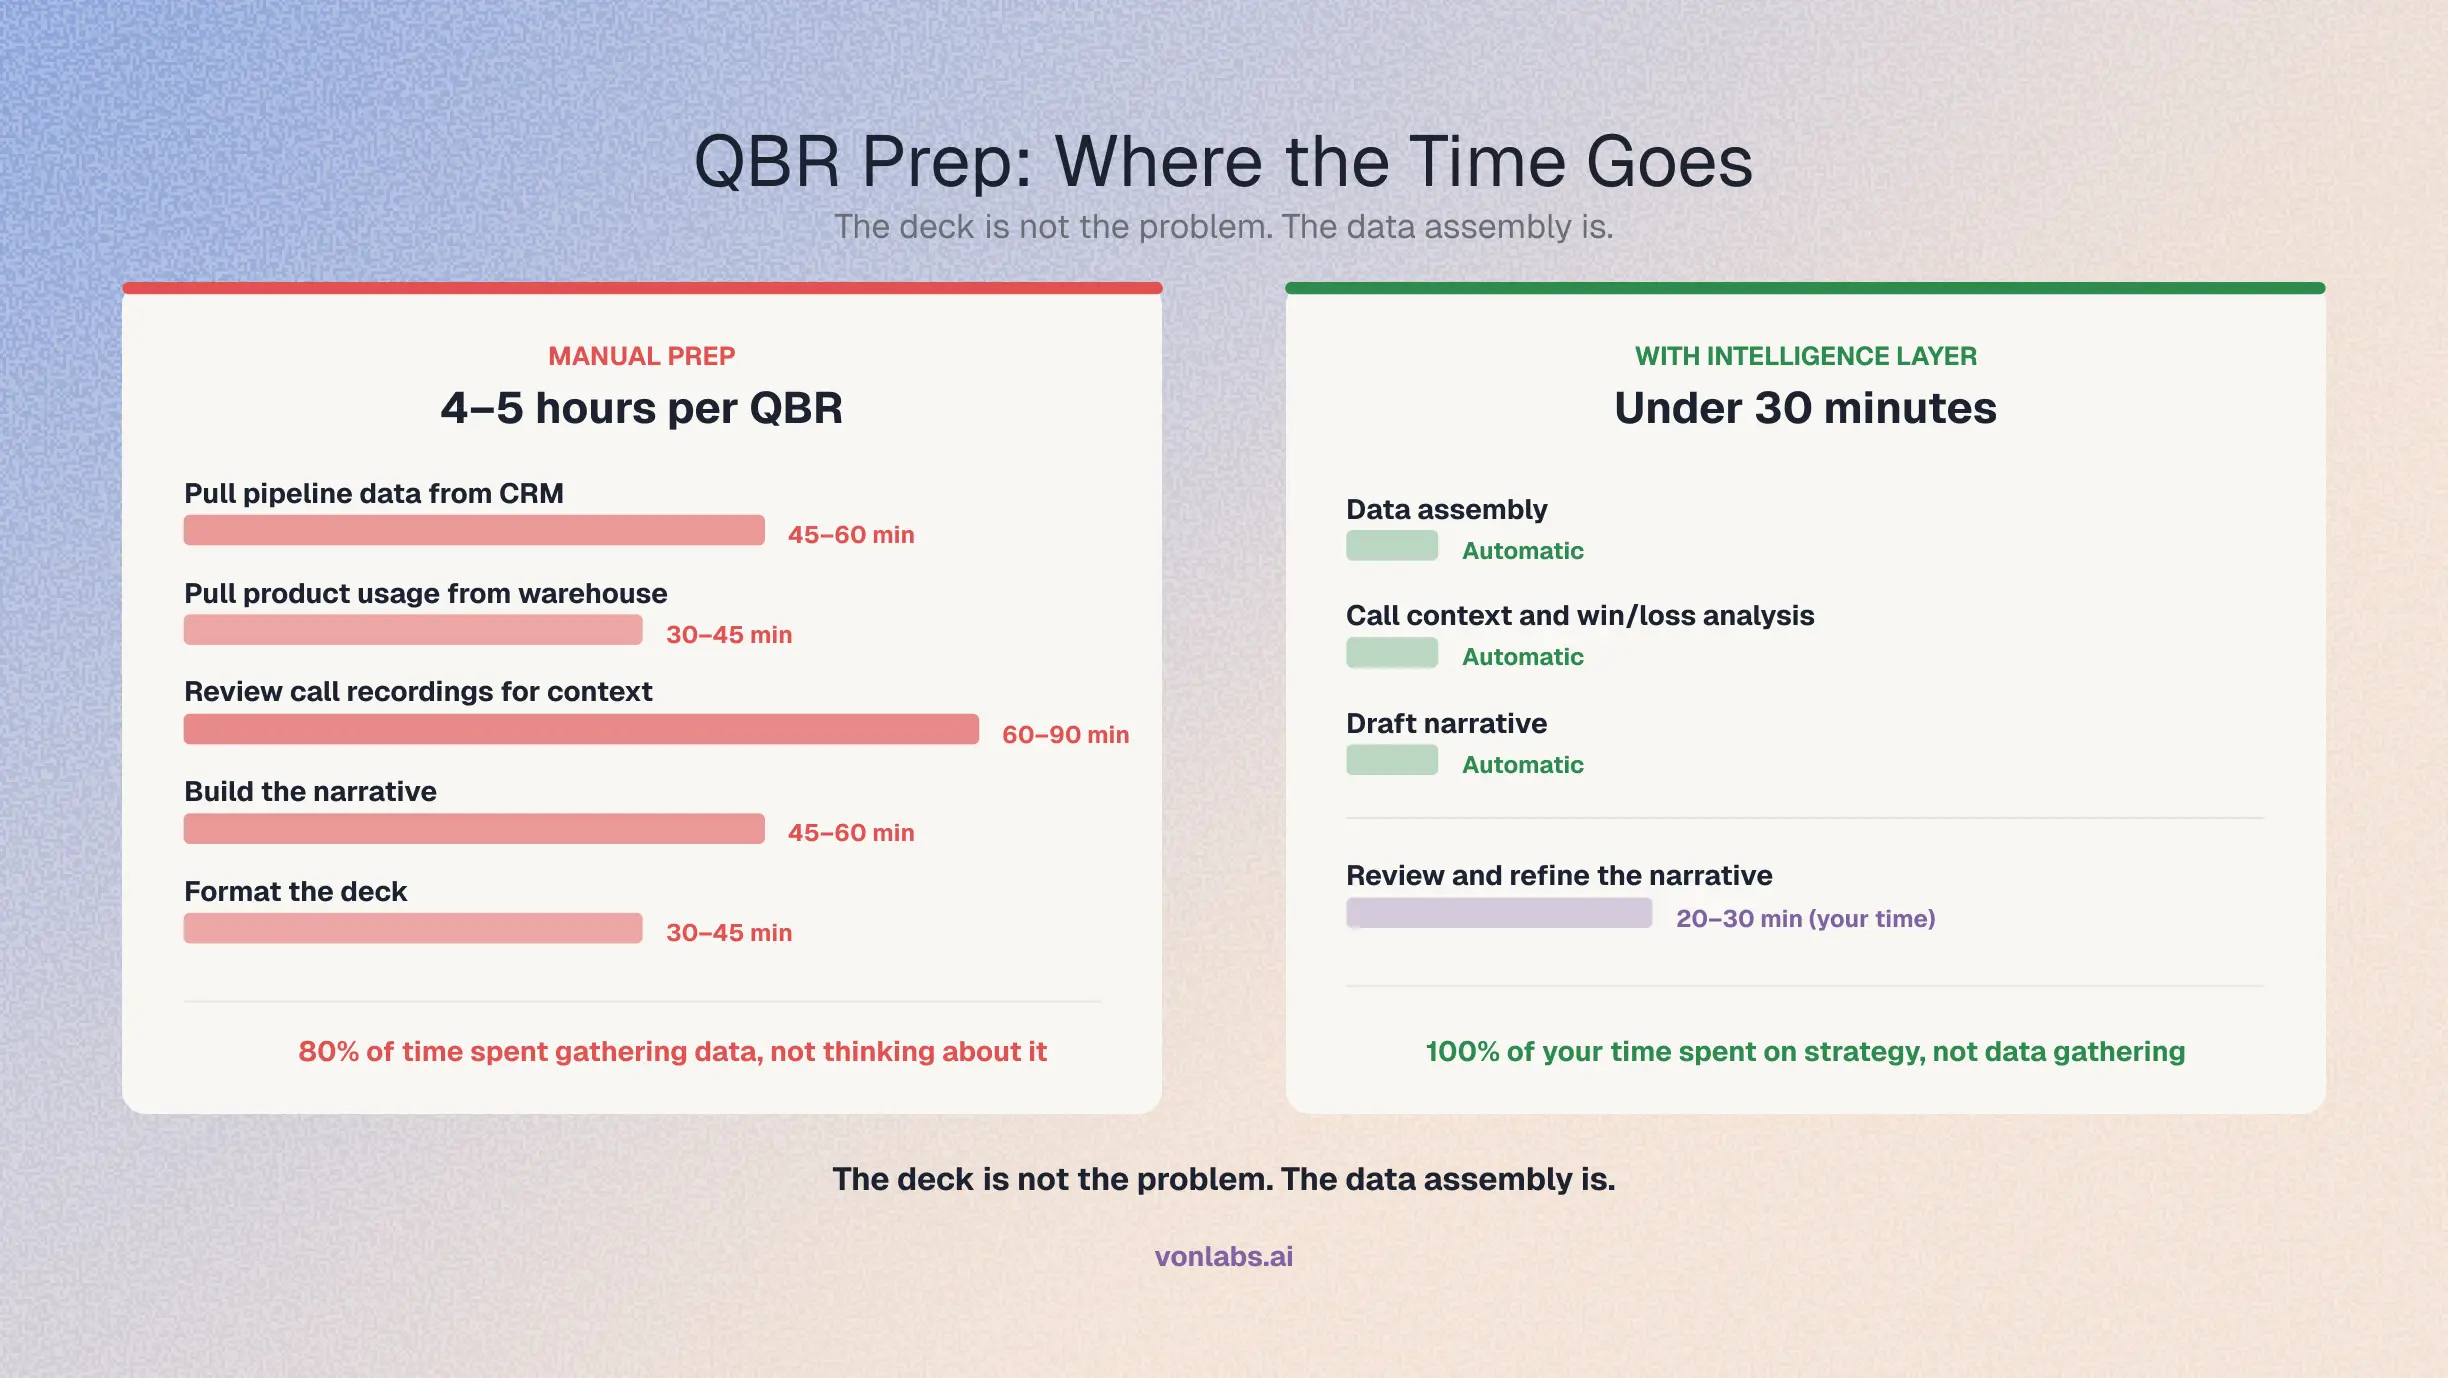
Customer Success Managers spend 4–5 hours every quarter pulling data from scattered systems, rebuilding the same PowerPoint deck, and formatting slides that leadership skims in the first five minutes. The meeting itself runs 60–90 minutes. The prep takes longer than the review.
The problem is not the template. It is the data assembly. A QBR deck requires pipeline data from the CRM, product usage from the data warehouse, call context from the conversation platform, and account health from three different dashboards. Stitching those together is the work — not the slides.
Here is a six-section QBR framework that works for both internal leadership reviews and customer-facing business reviews, plus how to cut the assembly time from hours to minutes.
The Six-Section QBR Framework
Every effective QBR follows the same arc: what happened, what it means, and what we do next. These six sections cover that arc in 12–18 slides.
Where the Prep Time Goes
The six sections above are straightforward. The time sink is not deciding what to include — it is gathering the data to include it.
A typical QBR prep workflow:
1. Pull pipeline data from Salesforce. Export reports, filter by quarter, calculate coverage ratios, format into slides. Time: 45–60 minutes.
2. Pull product usage from the data warehouse. Query adoption metrics, MAU, feature usage, health scores. Cross-reference with account list. Time: 30–45 minutes.
3. Review call recordings for win/loss context. Listen to or skim transcripts from key deals. Extract quotes, objections, and patterns. Time: 60–90 minutes.
4. Build the narrative. Connect the data points into a story. What happened, why, and what it means for next quarter. Time: 45–60 minutes.
5. Format the deck. Drop everything into slides, align charts, add logos, check formatting. Time: 30–45 minutes.
Total: 3.5–5 hours. And this repeats every quarter, for every team or customer.
What Makes a QBR Worth the Meeting
The best QBRs are not presentations. They are decision meetings. Three principles:
Lead with the takeaway, not the data. Every slide title should be the conclusion, not the topic. Not “Pipeline Overview” — “Pipeline coverage is 2.1x, below the 3x target.” The audience reads the title and decides whether to engage with the detail.
Name three decisions before you build the deck. Walk into the QBR with a written list of three decisions you need made. If you cannot name them, the meeting will produce none. The deck exists to support those decisions, not to report on the quarter.
Send the deck 48 hours early. Use the meeting for discussion, not first-time reading. If leadership spends the first 20 minutes absorbing numbers, you have lost the most valuable part of the meeting.
Cutting Prep from Hours to Minutes
The QBR prep problem is a data assembly problem. Each section requires data from a different system, and the person building the deck is the human integration layer between those systems.
An intelligence layer like Von eliminates the assembly step. It connects to the CRM, call recordings, email threads, and data warehouse, and can generate each QBR section from a single prompt: pipeline health with coverage ratios, win/loss analysis with call-sourced evidence, customer health with product usage data, and a draft narrative connecting them.
The result: QBR prep drops from 4–5 hours to under 30 minutes. The remaining time is spent reviewing and refining the narrative — the strategic work that the CSM or RevOps leader was hired to do.
For more on how this works across the full RevOps workflow, see The AI VP of RevOps.
Frequently Asked Questions
How many slides should a QBR deck be? 12–18 slides for an internal leadership review. 15–20 for a customer-facing QBR. Anything over 25 means you are presenting data, not driving decisions. If the deck is longer than the meeting can absorb, cut sections.
What should a QBR deck include? Six sections: executive summary, performance vs. plan, pipeline health, customer health, wins/losses/lessons, and next quarter plan. Each section should lead with a takeaway headline, not a topic label.
How long should QBR prep take? With manual data assembly, 4–5 hours is typical. With automated data collection and an intelligence layer, under 30 minutes. The goal is to spend prep time on narrative and strategy, not data gathering.
How often should you run QBRs? Quarterly is the standard cadence. Some teams run monthly business reviews (MBRs) for faster-moving businesses, but quarterly is the right rhythm for strategic reviews that require cross-functional data.
What is the difference between an internal QBR and a customer-facing QBR? An internal QBR reviews your team’s performance: pipeline, quota attainment, win/loss patterns, and next quarter plan. A customer-facing QBR reviews the value delivered to a specific customer: adoption, ROI, health, and renewal/expansion discussion. The six-section framework works for both — adjust the data sources and audience.
RevOps Playbook Series
- How to Run a Pipeline Review That Finds Real Risk
- How to Build a Sales Forecast That Leadership Trusts
- How to Build a QBR Deck in Minutes, Not Days
- How to Set Up Territory Planning Without a Dedicated Analyst
- How to Track Competitor Mentions Across Your Deal History
- How to Measure Rep Performance Beyond Quota Attainment
- How to Keep Your CRM Clean Without Policing Reps
- How to Prep for a Customer Call in 5 Minutes