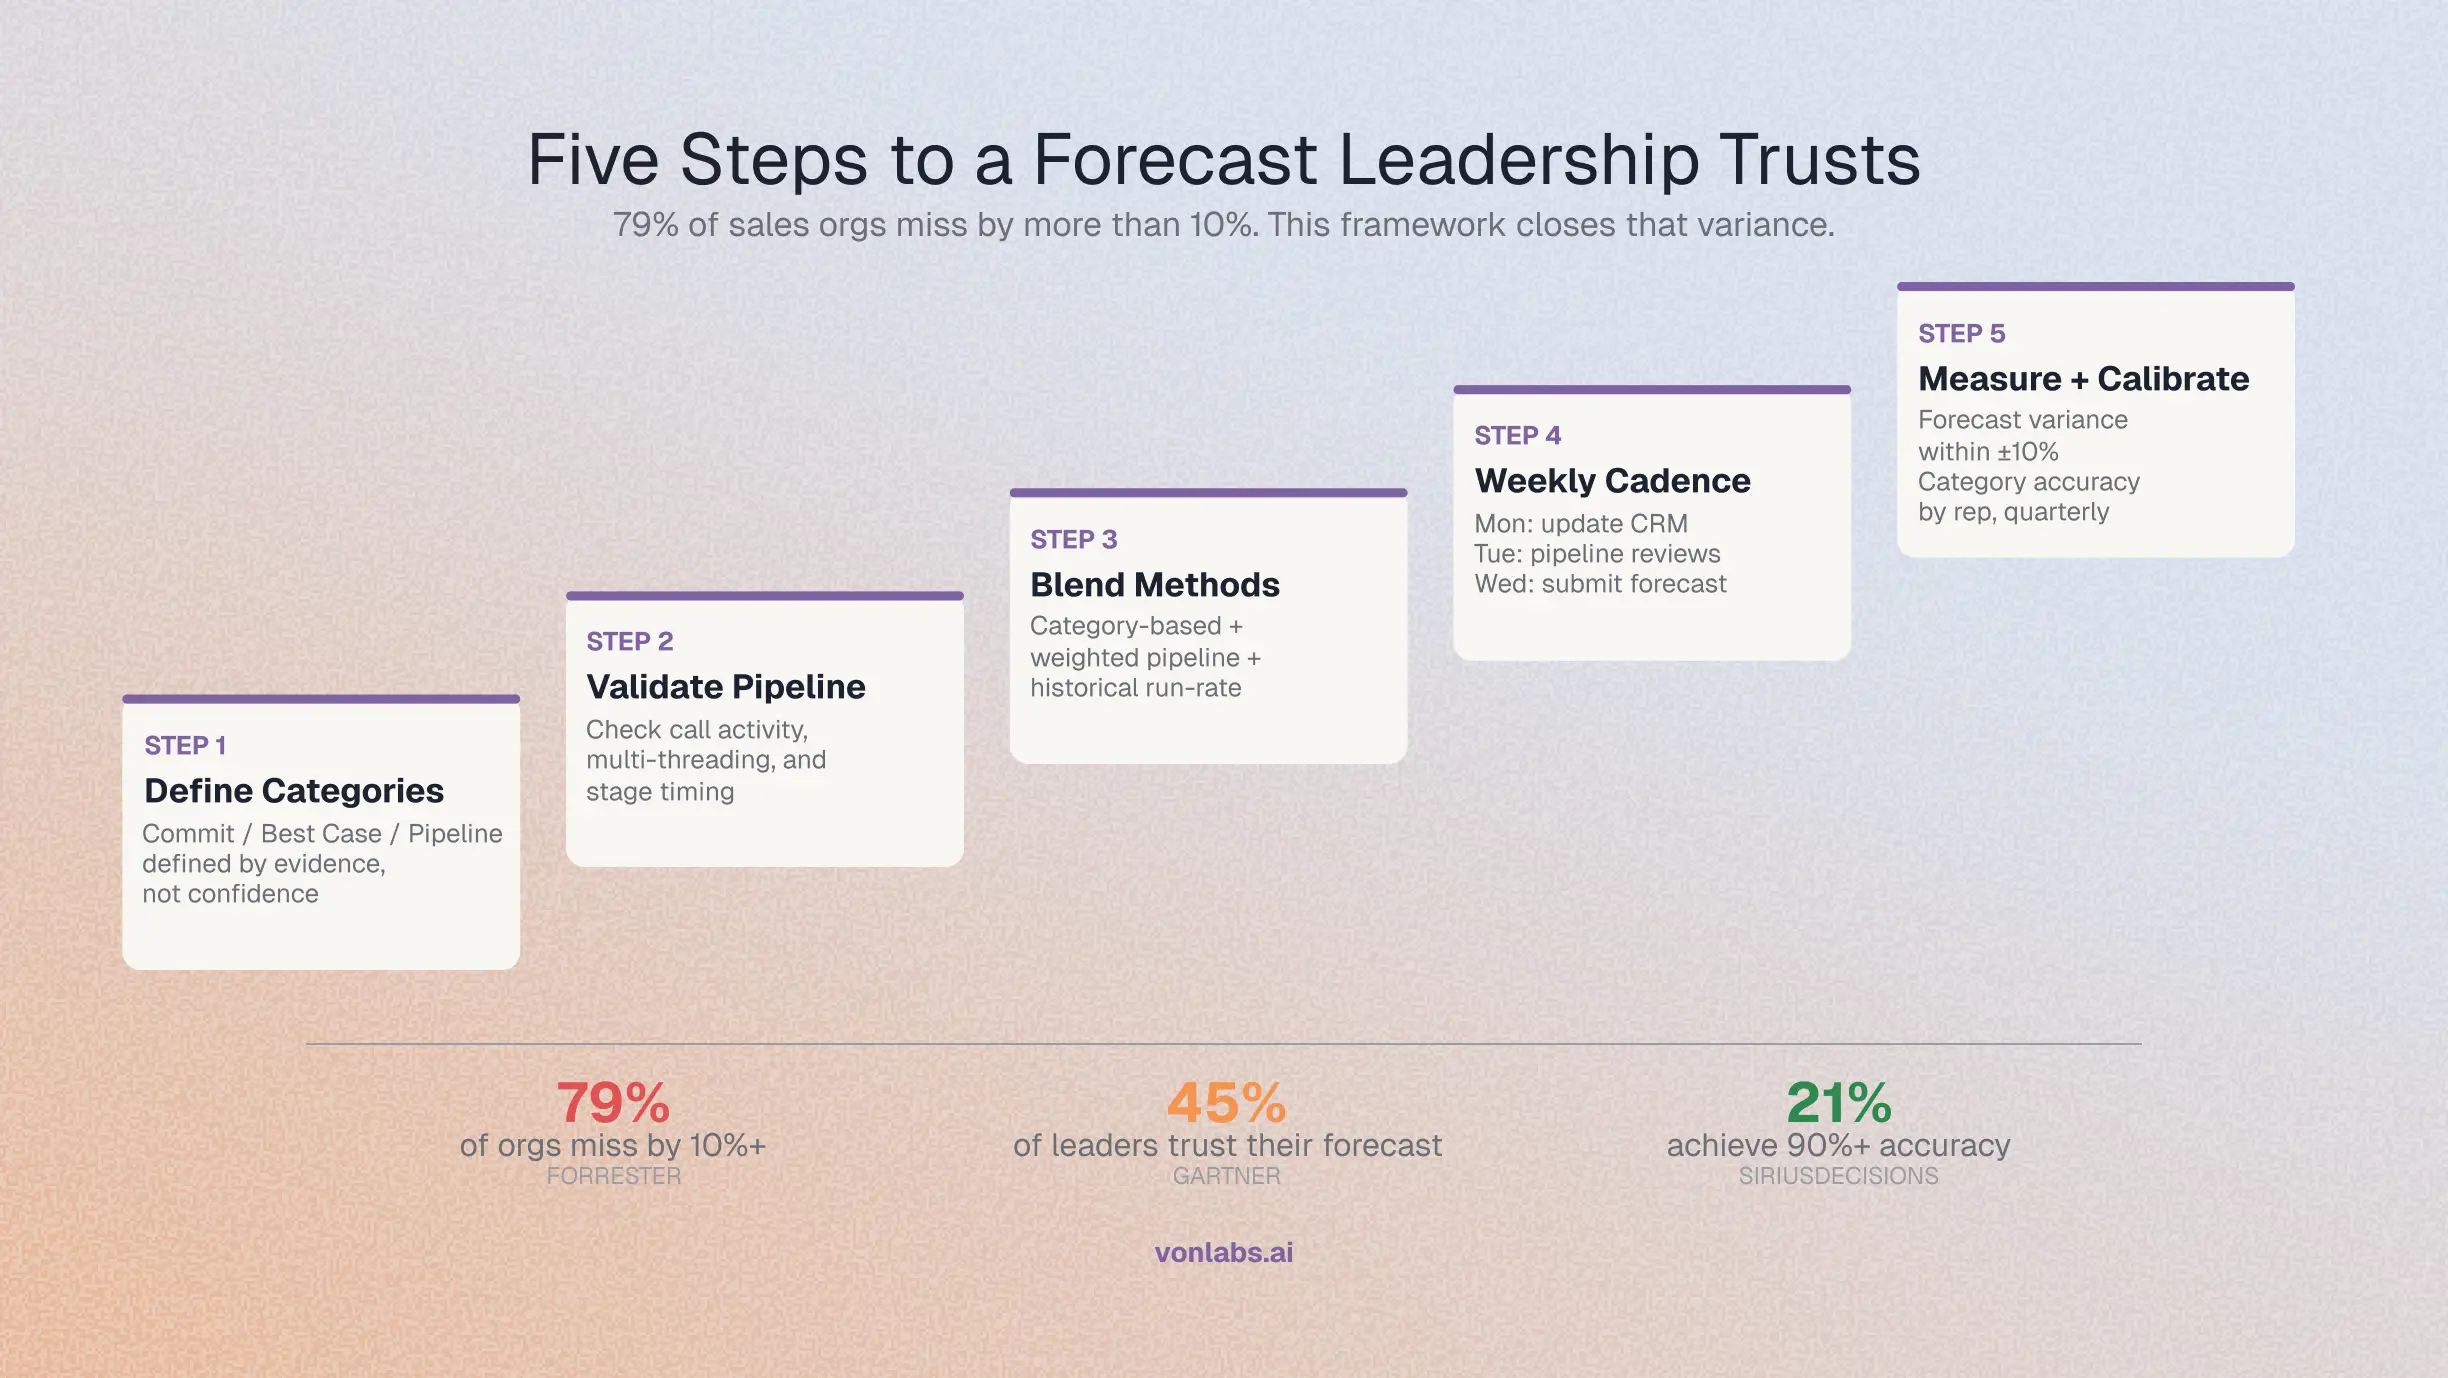
According to Forrester, 79% of sales organizations miss their forecast by more than 10%. Gartner reports that only 45% of sales leaders have high confidence in their forecast accuracy. The median forecast accuracy across B2B organizations sits between 70% and 79%.
The problem is rarely the model. It’s the data feeding the model. A weighted pipeline forecast built on incomplete CRM records, subjective rep judgment, and disconnected systems will miss — no matter how sophisticated the math.
Here’s a five-step framework for building a forecast your leadership team can plan around.
Step 1: Define Your Forecast Categories with Evidence Requirements
Most forecast misses start with ambiguous categories. If “Commit” means something different to every rep, the roll-up is meaningless.
Define each category by the evidence required to place a deal there:
The key: evidence, not confidence. A rep saying “I feel good about this deal” is not evidence. A confirmed close date with a signed mutual action plan is.
Step 2: Validate the Pipeline Feeding the Forecast
The forecast is only as accurate as the pipeline behind it. Before you forecast, inspect the pipeline for risk signals. (For the full inspection framework, see How to Run a Pipeline Review That Finds Real Risk.)
Three signals to check before any forecast submission:
Call activity. Deals with fewer than two recorded calls past discovery close at 8%. Deals with two or more close at 29.7% — a 3.6x improvement. If a Commit deal has one call, it’s not a Commit.
Multi-threading. Single-threaded deals (one contact) close at 4.1%. If a Best Case deal has one point of contact, it belongs in Pipeline.
Stage timing. Deals that exceed 2x the average stage duration for won deals are stalling. 77% of lost deals never make it past discovery. If a deal has been in the same stage for twice the benchmark, downgrade it.
Step 3: Build the Forecast from Multiple Inputs
No single method is accurate on its own. The most reliable forecasts blend at least two approaches:
The practical combination: use category-based as the primary (it reflects rep and manager judgment), validate it against weighted pipeline (the math check), and compare both to historical run-rate (the reality check). If all three converge, the forecast is solid. If they diverge, investigate the deals causing the spread.
Step 4: Run a Weekly Forecast Cadence
A forecast submitted once a quarter is a guess. A forecast refined weekly is a plan.
The weekly cadence:
Monday: Reps update their pipeline and forecast categories based on the previous week’s activity. This is a 10-minute CRM update, not a meeting.
Tuesday: Manager runs 1:1 pipeline reviews (30 minutes each). Inspect the 3–5 at-risk deals, validate forecast categories, and agree on actions.
Wednesday: Manager submits the team forecast. The number reflects what was inspected on Tuesday, not what was hoped for on Monday.
Thursday/Friday: Execute the actions from the pipeline review. Schedule the calls, send the proposals, engage the stakeholders. The forecast improves because the pipeline improves.
Step 5: Measure and Calibrate
Track forecast accuracy at the rep level, not just the team level. Two metrics:
Forecast variance: (Forecasted Revenue − Actual Revenue) ÷ Forecasted Revenue. Target: within ±10%. Anything beyond 15% needs a root cause analysis.
Category accuracy: What percentage of Commit deals closed? What percentage of Best Case? If Commit deals close at 60% instead of 90%, the category definition is broken — fix the evidence requirements, not the reps.
Review these metrics quarterly. Adjust stage probabilities and category definitions based on what the data shows, not what the process document says.
What Changes When the Data Is Automatic
This framework works with manual effort. But it requires reps to update the CRM accurately, managers to pull signal data before every review, and someone to reconcile three forecast methods every week. That’s 5–10 hours of RevOps time per week that could be spent on strategy.
An intelligence layer like Von automates the signal collection (call activity, multi-threading, stage timing), validates forecast categories against evidence, and surfaces the deals where the category and the signals disagree. The forecast becomes a conversation about the 5 deals that need attention, not a data-gathering exercise across 50.
Frequently Asked Questions
What is a good sales forecast accuracy? 80–85% is acceptable, 85–95% is good, and 95%+ is world-class. According to Forrester, only 21% of companies achieve 90% or greater accuracy. The median B2B forecast accuracy sits between 70% and 79%.
How do you measure sales forecast accuracy? Two primary metrics: Forecast Variance (Forecasted Revenue minus Actual Revenue, divided by Forecasted Revenue) and Mean Absolute Percentage Error (MAPE), which averages the absolute percentage error across all forecast periods.
What is the difference between weighted pipeline and category-based forecasting? Weighted pipeline multiplies each deal by its stage probability (e.g., a $100K deal at 50% contributes $50K). Category-based forecasting groups deals into Commit, Best Case, and Pipeline based on evidence, then applies different weights to each category. Category-based is more accurate because it incorporates deal-level judgment, not just stage position.
How often should you update your sales forecast? Weekly. A forecast submitted once a quarter is a guess. Weekly updates based on pipeline reviews and deal inspection produce forecasts that leadership can plan around. The weekly cadence also catches risk early enough to intervene.
Why do sales reps sandbag their forecasts? Reps sandbag when they fear consequences for missing a committed number. Evidence-based forecasting removes the incentive because the data — not the rep — tells the story. When forecast categories are defined by evidence (confirmed close date, mutual action plan, economic buyer engaged), there is less room for subjective inflation or deflation.
RevOps Playbook Series
- How to Run a Pipeline Review That Finds Real Risk
- How to Build a Sales Forecast That Leadership Trusts
- How to Build a QBR Deck in Minutes, Not Days
- How to Set Up Territory Planning Without a Dedicated Analyst
- How to Track Competitor Mentions Across Your Deal History
- How to Measure Rep Performance Beyond Quota Attainment
- How to Keep Your CRM Clean Without Policing Reps
- How to Prep for a Customer Call in 5 Minutes