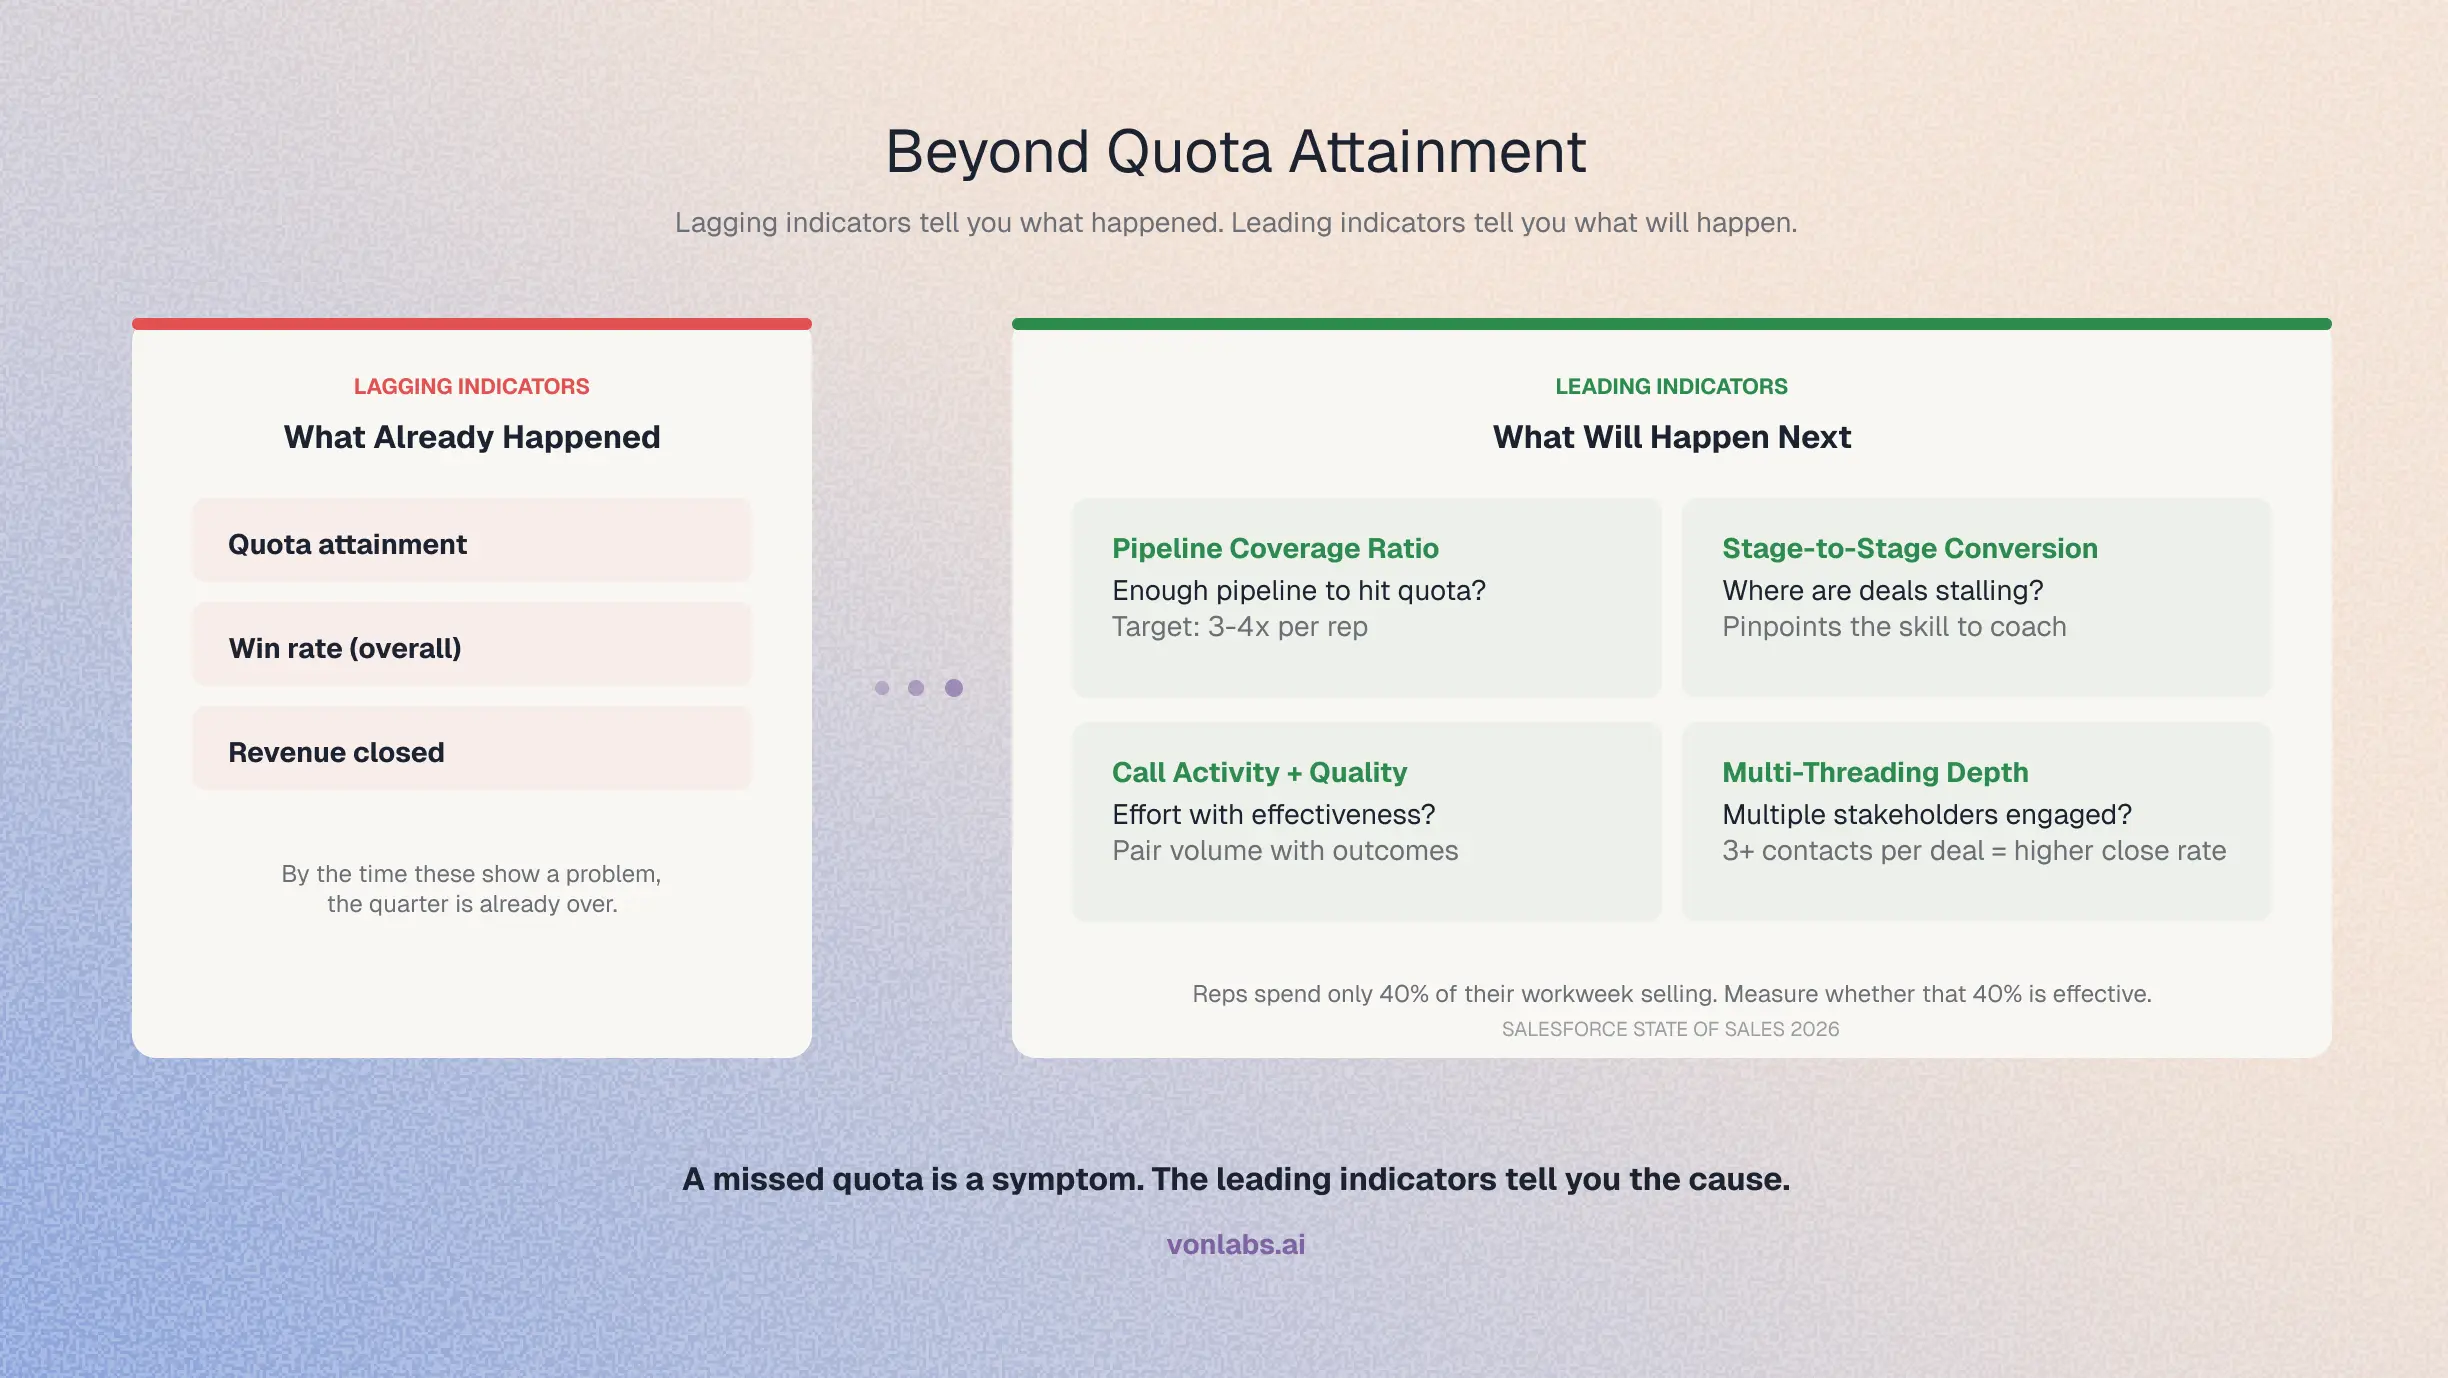
Quota attainment tells you what happened. It does not tell you why, and it does not tell you what will happen next quarter. A rep who hit 120% by closing one large deal that slipped from last quarter looks identical to a rep who hit 120% by running a disciplined pipeline. One is repeatable. The other is luck.
According to Salesforce’s 2026 State of Sales report, reps spend only 40% of their average workweek selling. The other 60% goes to CRM updates, internal meetings, and admin. Measuring only quota attainment ignores whether a rep is spending that 40% effectively.
Why Quota Attainment Alone Misleads
Two reps both hit 100% of quota. One has a healthy pipeline for next quarter, strong multi-threading across deals, and consistent call activity. The other closed everything in the pipeline and has nothing left. The quota attainment number is identical. The forecast implications are opposite.
Varicent calls this the “quota illusion”: a team average of 95% attainment looks healthy until you see that half the reps are below 70% while a few exceed 150%. The headline number hides the operating reality.
The fix is measuring leading indicators alongside the lagging ones. Leading indicators show you what is coming. Lagging indicators confirm what already happened.
Leading vs Lagging Indicators
Four Leading Indicators That Predict Performance
1. Pipeline Coverage Ratio
Pipeline coverage compares the total value of a rep’s open pipeline to their quota. A rep with $300K in pipeline against a $100K quota has 3x coverage. Most B2B SaaS teams need 3-4x coverage because not every deal closes.
Measure this per rep, not as a team average. A team with 3.5x coverage could have one rep at 6x and another at 1x. The team number looks fine. The individual numbers show that one rep will miss.
2. Stage-to-Stage Conversion
Overall win rate hides where deals are lost. A rep with a 25% win rate could be losing 60% of deals at discovery (a qualification problem) or losing 60% at negotiation (a pricing problem). According to Retorio’s 2026 analysis, win rate by stage is one of the strongest predictors of quota attainment because it pinpoints the exact skill to coach.
3. Call Activity and Quality
Activity volume (calls made, emails sent, meetings held) shows effort. But effort without quality is noise. A rep making 50 calls a week with no pipeline creation has a targeting problem, not an effort problem.
Pair activity volume with activity outcomes: calls that result in a next step, emails that get a reply, meetings that advance the deal to the next stage. This separates productive activity from busy work.
4. Multi-Threading Depth
A deal with one contact engaged is fragile. If that contact leaves, changes roles, or loses budget authority, the deal dies. Multi-threading — engaging multiple stakeholders in the buying committee — is one of the strongest predictors of deal outcomes.
Measure the number of unique contacts engaged per deal (calls, emails, meetings). Compare this across reps. Reps who consistently engage 3+ contacts per deal close at significantly higher rates than those who rely on a single thread.
The Diagnostic Framework
When a rep misses quota, the leading indicators tell you why:
This framework turns a missed quota from a performance conversation into a coaching conversation. The rep does not need to "sell harder." They need to fix a specific behavior that the data identifies.
What Changes with an Intelligence Layer
Pulling these metrics manually requires querying the CRM for pipeline data, the call platform for activity and quality signals, and email for engagement patterns. Most managers do not have time to assemble this for every rep every week.
An intelligence layer like Von connects to all of these systems and surfaces the leading indicators per rep automatically. Ask “which reps have less than 2x pipeline coverage for next quarter?” or “which reps are single-threaded on their top 5 deals?” and get an answer in seconds, not hours.
For more on how pipeline reviews use these signals, see How to Run a Pipeline Review That Finds Real Risk.
Frequently Asked Questions
What are leading indicators in sales? Leading indicators are metrics that predict future performance before the quarter ends. They include pipeline coverage ratio, stage-to-stage conversion rates, call activity and quality, and multi-threading depth. Unlike lagging indicators (quota attainment, win rate), leading indicators give managers time to intervene.
What percentage of reps should hit quota? In a healthy B2B SaaS org, 55-65% of reps hit quota. If fewer than 50% are hitting, the issue is likely territory design or quota setting, not individual performance. If more than 80% are hitting, quotas may be set too low.
How do you measure sales rep quality, not just quantity? Pair activity volume with activity outcomes. Instead of counting calls made, count calls that resulted in a next step. Instead of counting emails sent, count emails that got a reply. Instead of counting meetings held, count meetings that advanced the deal to the next stage. This separates productive activity from busy work.
What is pipeline coverage ratio? Pipeline coverage ratio is the total value of open pipeline divided by the quota target. A ratio of 3x means the rep has three times their quota in pipeline. Most B2B SaaS teams need 3-4x coverage to account for deals that stall or close lost.
How do you coach a rep who missed quota? Use leading indicators to diagnose the root cause. Low pipeline coverage means a prospecting problem. Low stage conversion means a skill problem at a specific stage. High activity with low outcomes means a targeting problem. Single-threaded deals mean a stakeholder engagement problem. Each diagnosis leads to a different coaching action.
RevOps Playbook Series
- How to Run a Pipeline Review That Finds Real Risk
- How to Build a Sales Forecast That Leadership Trusts
- How to Build a QBR Deck in Minutes, Not Days
- How to Set Up Territory Planning Without a Dedicated Analyst
- How to Track Competitor Mentions Across Your Deal History
- How to Measure Rep Performance Beyond Quota Attainment
- How to Keep Your CRM Clean Without Policing Reps
- How to Prep for a Customer Call in 5 Minutes