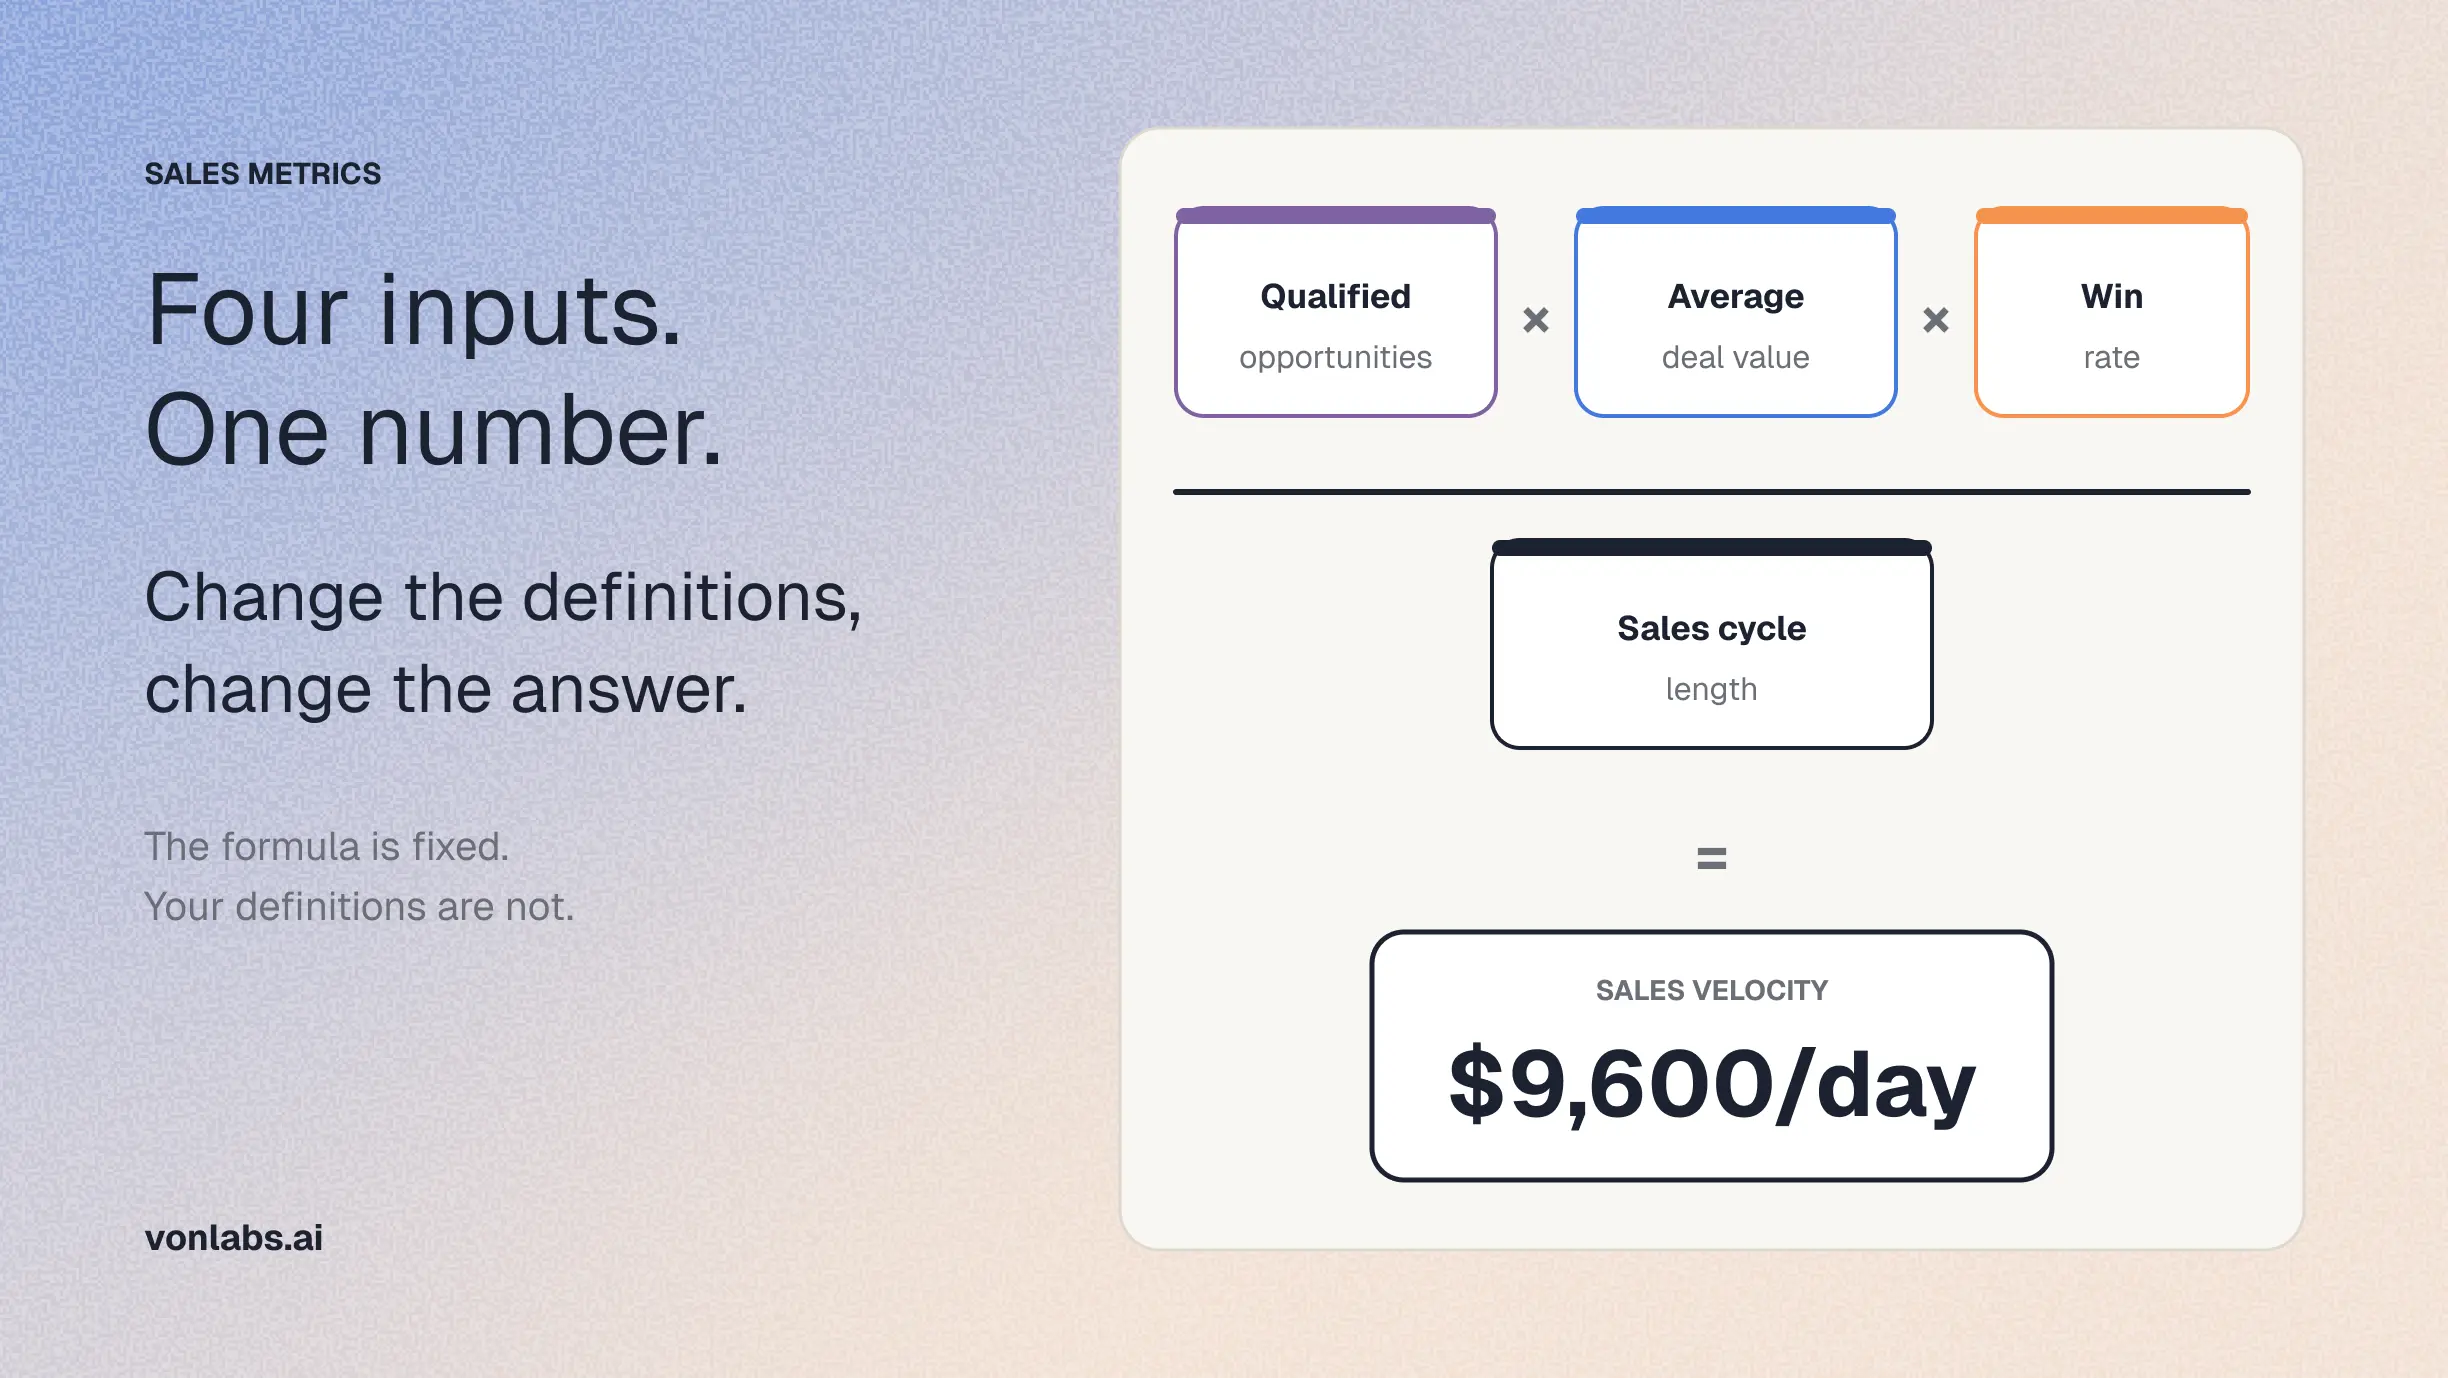
Sales velocity tells you how much revenue your pipeline produces per day. The formula has four inputs, and every major source agrees on what they are. What the sources do not settle is how each input is defined, and that choice can more than double the answer from the same CRM data.
This guide covers the formula, a worked example, and the four definitions you need to agree on before the number is worth reporting.
The sales velocity formula
Sales velocity = (Number of opportunities × Average deal value × Win rate) ÷ Sales cycle length
The result is revenue per unit of time. If the sales cycle is measured in days, the output is revenue per day. Salesforce, HubSpot, and Zendesk all use this same four-input equation.
A worked example
Suppose a team has 120 qualified opportunities, an average deal value of $24,000, a 30% win rate, and a 90-day sales cycle.
The quarterly figure equals the numerator here because the cycle is 90 days. That is a coincidence of this example, not a rule.
One unit warning: HubSpot measures sales cycle length in months, while Salesforce and Zendesk measure it in days. Both work, but the output changes from revenue per month to revenue per day. Pick one unit and label it.
The formula is settled. The inputs are not.
Each input depends on a decision your team has to make. Here is what changes when the same team makes a different, defensible choice for each one.
None of these alternatives is a calculation error. Each is a definition some team uses. The problem is that they produce very different numbers and look identical on a dashboard.
1. Which opportunities count
Salesforce, HubSpot and Zendesk all specify qualified opportunities rather than raw leads. Agree on the stage or event that makes an opportunity qualified, and use it consistently. Counting every opportunity ever created inflates the result, because many of them will never be worked.
2. Which deal value to use
Decide which field represents deal value and which motions belong in it. New business, expansion and renewal deals have different sizes and different cycles. Blending them into one average usually describes none of them well. If your CRM has more than one amount field, name the one the metric uses.
3. Which win rate to use
Win rate has several valid denominators, and each one changes velocity directly. Use the win rate that matches your opportunity count: if the first input is qualified opportunities, the win rate should be calculated from qualified opportunities too. Mixing populations is the most common way the formula goes wrong. Our guide to calculating sales win rate covers the denominator choices in detail.
4. When the sales cycle clock starts and stops
The cycle can run from opportunity creation, from qualification, or from first meeting, and it usually stops at close date. Measure it on won deals only, or decide explicitly to include losses. A cycle measured from qualification will always be shorter than one measured from creation, which raises velocity without any change in how fast the team sells.
How to make sales velocity reliable
Calculate it by segment. HubSpot recommends separating small, mid-market and enterprise pipelines and running the equation for each one. A blended number hides the fact that segments move at very different speeds.
Keep all four inputs on the same population. The opportunity count, deal value, win rate and cycle length should all come from the same motion, segment and time window.
Use a consistent lookback window. Choose a period long enough to cover at least one full sales cycle, so a single large deal does not swing the result.
Track the inputs, not only the output. Velocity is a summary. When it moves, the useful question is which of the four inputs moved and why.
Why the same CRM produces different velocity numbers
When two leaders report different sales velocity for the same quarter, the data is rarely the problem. They are using different definitions for qualified pipeline, deal value, win rate or cycle start. The same issue shows up in sales forecasts, where a pipeline number is only as useful as the agreement behind it.
This is the job of a GTM brain. Von is a GTM AI system of intelligence that holds the definitions behind each metric: which stage qualifies an opportunity, which field carries deal value, which win-rate denominator applies, and when the cycle clock starts. Every report, dashboard and AI workflow then calculates sales velocity the same way, so a CRO and a RevOps lead asking the same question get the same answer.
A definition template for sales velocity
Write this down before you publish the metric:
"Sales velocity for [segment and motion] uses [opportunity population], average deal value from [field and motions], win rate calculated as [denominator], and sales cycle length measured from [start event] to [end event] on [won deals only / all closed deals], over a [lookback window], reported in revenue per [day / month]."
Frequently asked questions
What is the formula for sales velocity? Sales velocity equals the number of opportunities, times average deal value, times win rate, divided by sales cycle length. The result is revenue generated per unit of time.
What is a good sales velocity? There is no universal benchmark, because velocity depends on deal size, segment and sales motion. Compare your result against your own prior periods and against the same segment, calculated with the same definitions.
Is pipeline velocity the same as sales velocity? Zendesk treats sales velocity, pipeline velocity and sales funnel velocity as the same concept. Some teams use pipeline velocity to mean the speed of deals through stages, so confirm the definition before comparing numbers.
How do you calculate sales cycle length? Add the number of days each won deal took to close, then divide by the number of deals. Salesforce gives the example of three deals closing in two, four and six days, for an average of four days. Decide the start event first, since it changes the result.
How can you increase sales velocity? Increase qualified opportunities, raise average deal value, improve win rate, or shorten the sales cycle. Make sure an improvement comes from the team selling differently, not from a change in how one of the inputs is defined.
Sources
Salesforce: How to Supercharge Your Sales Velocity for Quicker Wins
HubSpot: Sales Velocity: What It Is & How to Measure It
Zendesk: What is sales velocity? Meaning, formula, and report