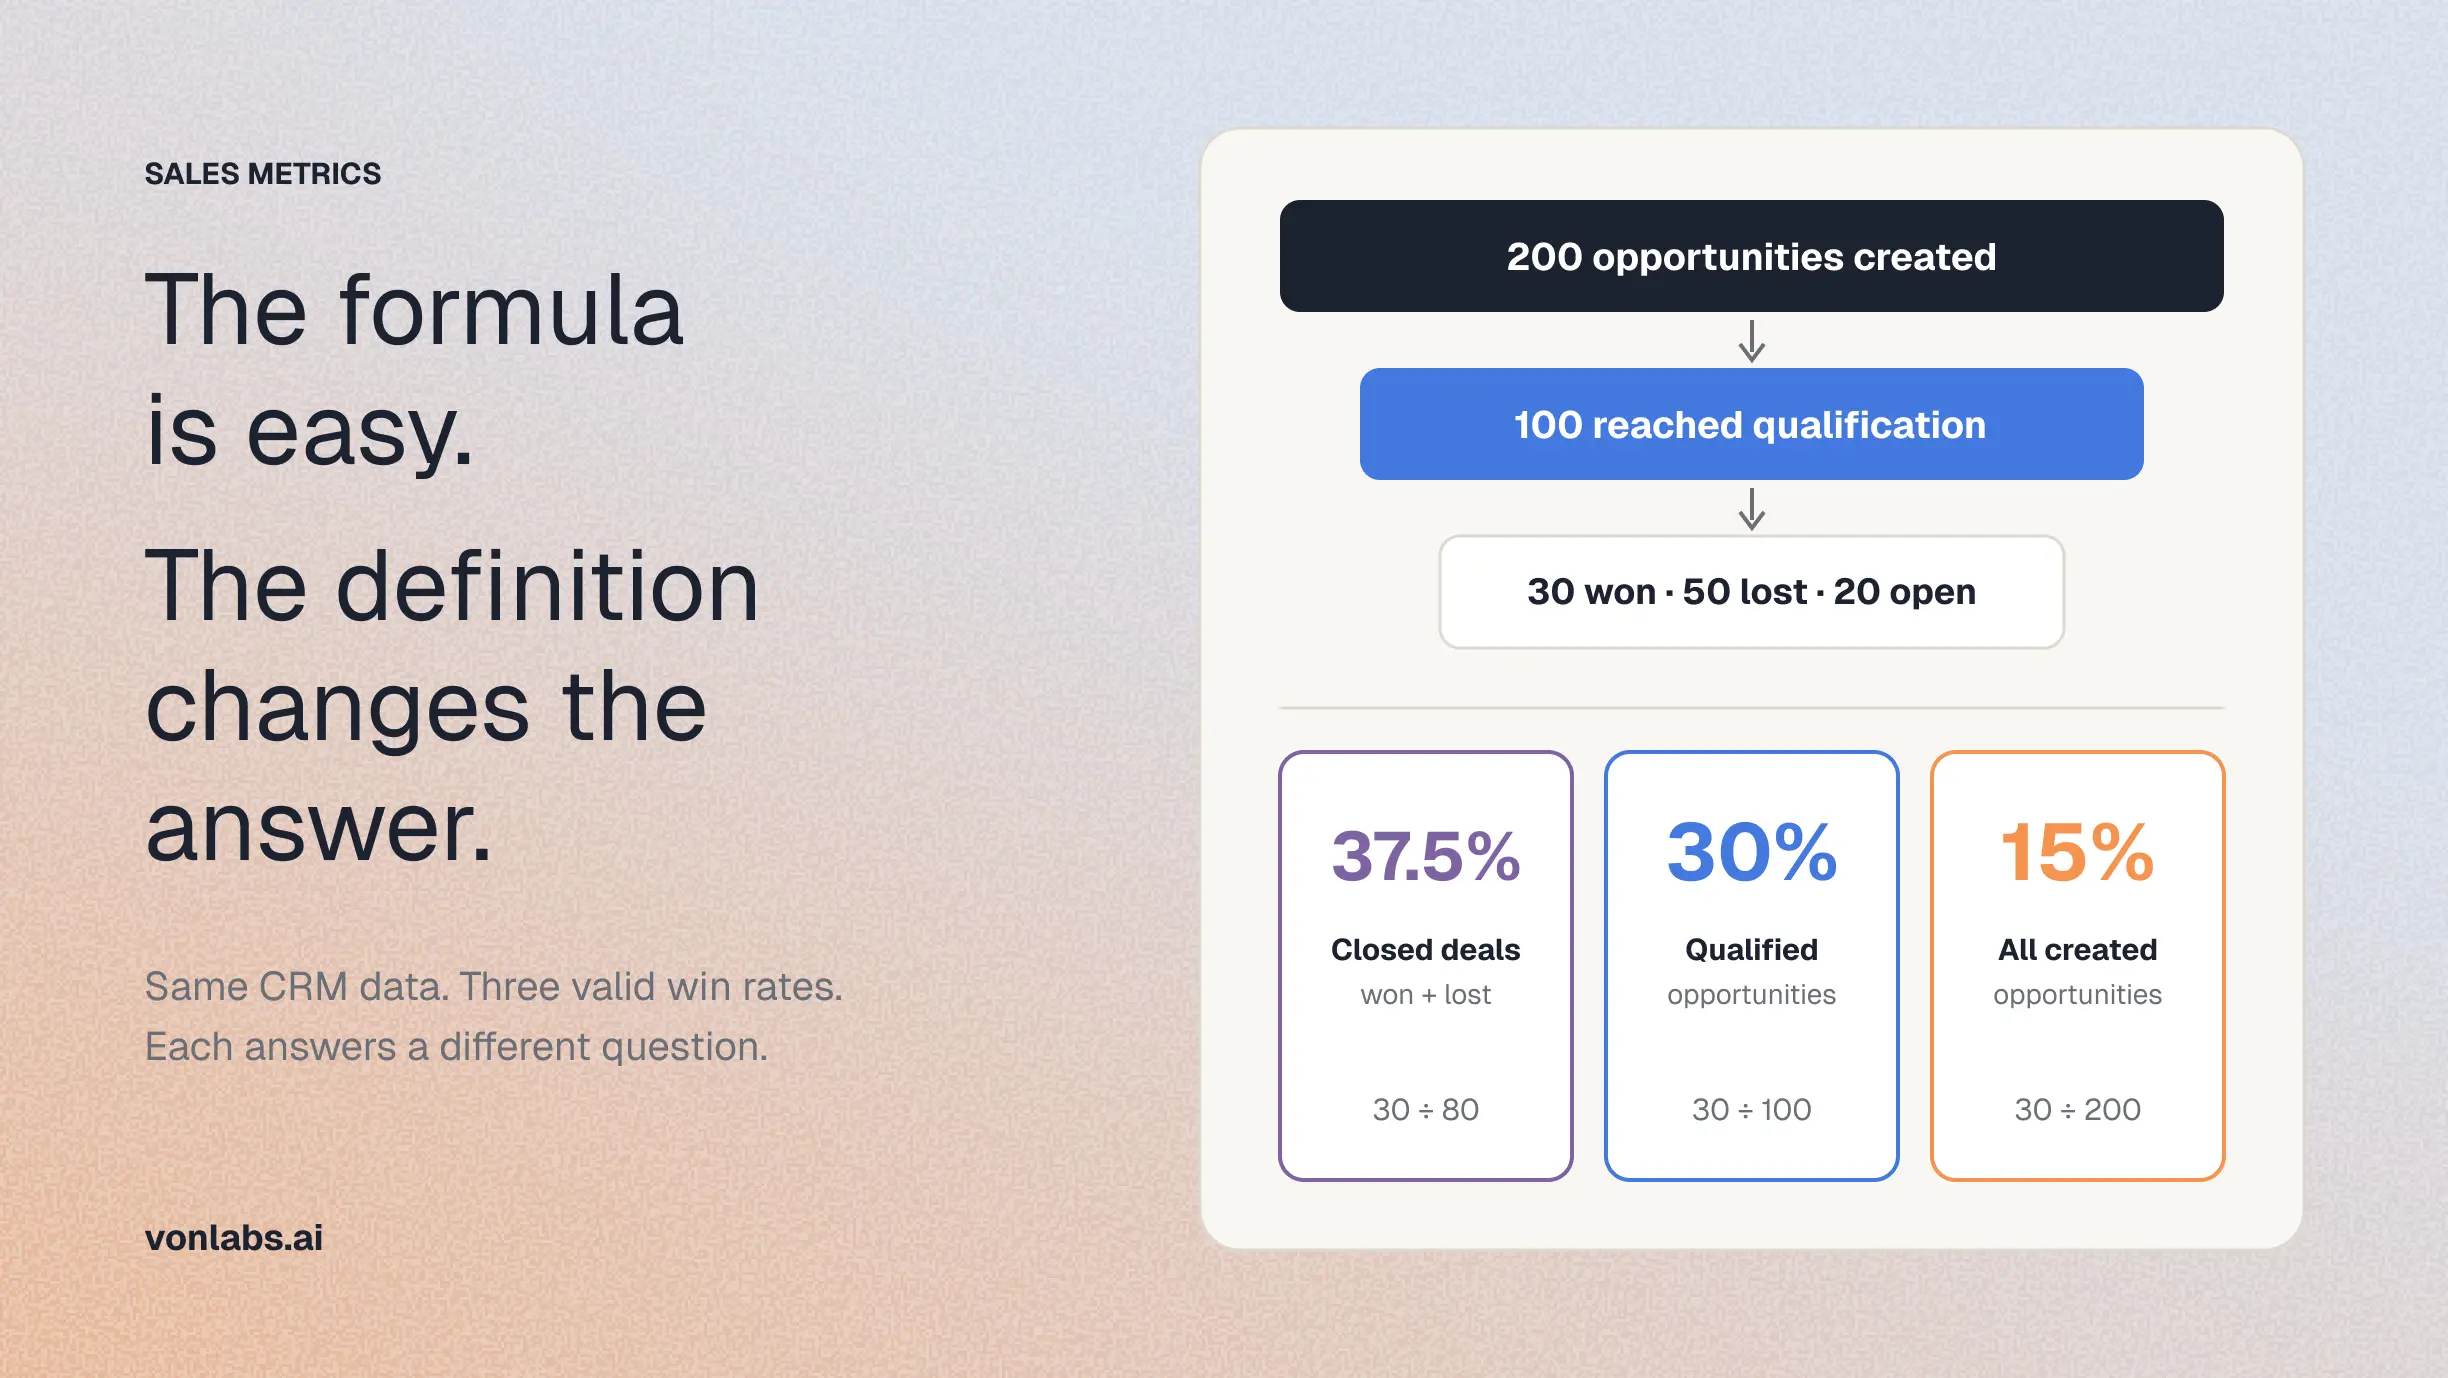
Sales win rate is simple to calculate. The hard part is agreeing on what belongs in the calculation. If one dashboard counts every closed deal, another excludes no-decisions, and a third starts at a later qualification stage, each can be mathematically correct and still tell a different story.
Start with the formula. Then make the inclusion rules explicit, so a CRO, RevOps leader, manager, and AI workflow all answer the same question.
The basic sales win-rate formula
Win rate = Won opportunities ÷ (Won opportunities + Lost opportunities) × 100
For example, suppose a team closed 80 opportunities in a quarter: 24 were won and 56 were lost. Its closed-opportunity win rate is 30%.
This is the standard closed-opportunity approach. Salesforce documents this version as won opportunities divided by closed opportunities.
Win rate vs. close rate
These terms are often used interchangeably, but they answer different questions.
The distinction matters because a team can have a strong win rate among qualified deals and a weak close rate from the top of the funnel. Salesforce treats close rate as a broader top-of-funnel conversion measure, while win rate focuses on qualified opportunities.
The denominator is the real decision
The numerator is usually straightforward: closed-won opportunities. The denominator is where teams diverge. Before publishing a win-rate number, decide which of these questions you are answering.
None is universally “right.” They answer different questions. The error is treating them as the same metric or changing the denominator without labeling the change.
Should no-decision deals count as losses?
Choose a rule and keep it consistent. Some teams count only opportunities where the buyer chose a competitor or incumbent as losses. Others include no-decision outcomes once a prospect has reached a meaningful evaluation point. HubSpot explicitly describes both conventions. The important part is documenting the choice before comparing periods, reps, segments, or motions.
A worked example: one data set, three win rates
Consider a team that created 200 opportunities in a quarter. Of those, 100 reached its qualification threshold. By quarter end, 30 were won, 50 were lost, and 20 remained open.
All three calculations use the same underlying data. None is a mistake. But they cannot be compared as if they describe the same point in the funnel.
How to make your win rate reliable
1. Define the opportunity population
Specify whether the report includes new business only, renewals, expansions, or all motions. A renewal with an existing customer should not quietly enter a new-business win-rate calculation unless that is the stated purpose.
2. Set a qualification threshold
Choose the event that makes an opportunity eligible for the metric: first discovery, completed demo, qualified stage, or a stricter stage such as proposal. The threshold should reflect a real buyer-side milestone, not an internal activity.
3. Decide how to treat terminal outcomes
Document whether closed-disqualified and no-decision opportunities are in the denominator. Do not let each report make the choice independently.
4. Use the same time basis
Decide whether the period is based on close date, creation date, or the date an opportunity reached the qualifying stage. For win rate, close date is commonly used for final outcomes, while stage-entry cohorts are useful for conversion analysis.
5. Segment before you act
An overall rate is a starting point, not a diagnosis. Break it out by segment, source, product, sales motion, deal size, and stage threshold. A blended metric can hide a healthy motion and an unhealthy one.
Why teams get different answers from the same CRM
Most reporting disagreements are definition disagreements disguised as data disagreements. One person filters on record type, another filters on opportunity type. One excludes disqualified deals, another includes them. One starts at discovery, another starts at demo. The CRM may hold every field needed to calculate the metric and still not tell people which calculation is authoritative.
That is where a GTM brain matters. Von is a GTM AI system of intelligence that captures the agreed semantics behind metrics: the sales motions to include, the qualifying stage, the terminal outcomes, and the time basis. The result is not merely a calculated percentage. It is a governed answer that stays consistent across reports, dashboards, and AI workflows.
A practical definition template
Use this statement before you publish a win-rate metric:
“Win rate is the percentage of [opportunity population] that [outcome], measured from [starting event or stage], for opportunities closed in [time basis]. The denominator [includes / excludes] [no-decision and disqualified outcomes].”
Example: “New-business win rate is the percentage of opportunities that reached Solution Demonstration or later and ultimately closed won, measured by close date. The denominator includes closed lost opportunities and excludes renewals and closed-disqualified deals.”
Frequently asked questions
What is the formula for sales win rate?
The common formula is closed-won opportunities divided by closed-won plus closed-lost opportunities, multiplied by 100. The correct denominator depends on the business definition you have agreed to use.
What is a good B2B sales win rate?
There is no universal benchmark. Deal complexity, customer segment, lead source, qualification bar, and sales motion all change the answer. Compare your rate against your own historical cohorts and comparable segments before comparing it with a broad external benchmark.
Should no-decision deals count as losses?
They can, provided the rule is stated and consistently applied. If a no-decision prospect reached a substantive evaluation point, including it can provide a more realistic view of conversion. If it did not, excluding it may better reflect late-stage sales execution.
What is the difference between win rate and close rate?
Win rate generally measures wins among qualified or closed opportunities. Close rate is commonly used for the broader conversion from all initial leads or contacts to customers.
Why do two sales dashboards show different win rates?
They may use different opportunity populations, stage thresholds, terminal-outcome rules, or time bases. Reconcile the definitions before reconciling the math.
Sources
Salesforce: Win Rate in Sales: What It Is, How To Calculate and Ways To Improve
Salesforce Help: Calculate Win Rate on Closed Opportunities in a Report
HubSpot: Sales Win Rate: How to Define, Calculate, and Improve It